
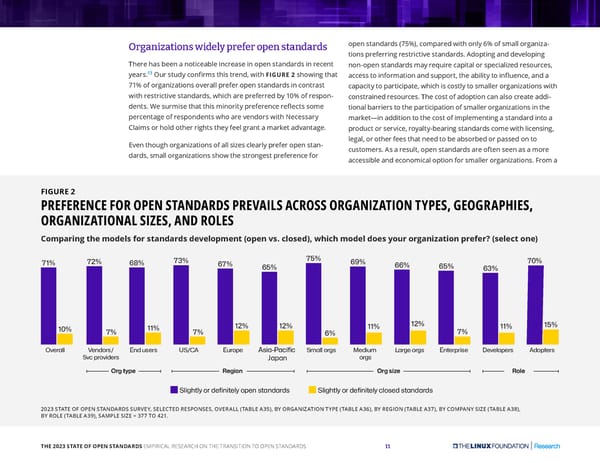
Organizations widely prefer open standards open standards (75%), compared with only 6% of small organiza- tions preferring restrictive standards. Adopting and developing There has been a noticeable increase in open standards in recent non-open standards may require capital or specialized resources, 13 Our study confirms this trend, with FIGURE 2 showing that years. access to information and support, the ability to influence, and a 71% of organizations overall prefer open standards in contrast capacity to participate, which is costly to smaller organizations with with restrictive standards, which are preferred by 10% of respon- constrained resources. The cost of adoption can also create addi- dents. We surmise that this minority preference reflects some tional barriers to the participation of smaller organizations in the percentage of respondents who are vendors with Necessary market—in addition to the cost of implementing a standard into a Claims or hold other rights they feel grant a market advantage. product or service, royalty-bearing standards come with licensing, Even though organizations of all sizes clearly prefer open stan- legal, or other fees that need to be absorbed or passed on to dards, small organizations show the strongest preference for customers. As a result, open standards are often seen as a more accessible and economical option for smaller organizations. From a FIGURE 2 PREFERENCE FOR OPEN STANDARDS PREVAILS ACROSS ORGANIZATION TYPES, GEOGRAPHIES, ORGANIZATIONAL SIZES, AND ROLES Comparing the models for standards development (open vs. closed), which model does your organization prefer? (select one) 71% 72% 68% 73% 67% 75% 69% 70% 65% 66% 65% 63% 10% 11% 12% 12% 11% 12% 11% 15% 7% 7% 6% 7% Ov�rall V�ndor�/ End u��r� US/CA Europ� A�ia-Paci�ic Small org� ��dium Larg� org� Ent�rpri�� D�v�lop�r� Adopt�r� Svc provid�r� org� Japan Org typ� R�gion Org �iz� Rol� Slightly or d��init�ly op�n �tandard� Slightly or d��init�ly clo��d �tandard� 2023 STATE OF OPEN STANDARDS SURVEY, SELECTED RESPONSES, OVERALL (TABLE A35), BY ORGANIZATION TYPE (TABLE A36), BY REGION (TABLE A37), BY COMPANY SIZE (TABLE A38), BY ROLE (TABLE A39), SAMPLE SIZE = 377 TO 421. THE 2023 STATE OF OPEN STANDARDS EMPIRICAL RESEARCH ON THE TRANSITION TO OPEN STANDARDS 11
 The 2023 State of Open Standards Page 10 Page 12