
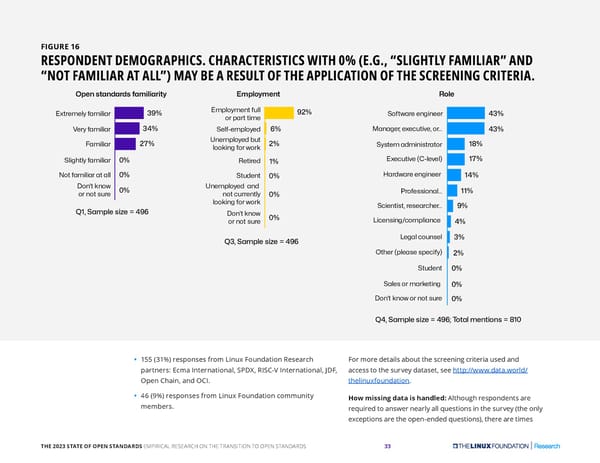
FIGURE 16 RESPONDENT DEMOGRAPHICS. CHARACTERISTICS WITH 0% (E.G., “SLIGHTLY FAMILIAR” AND “NOT FAMILIAR AT ALL”) MAY BE A RESULT OF THE APPLICATION OF THE SCREENING CRITERIA. Op�n �tandard� �amiliarity Employm�nt Rol� 39% Employm�nt �ull 92% 43% So�t�ar� �ngin��r Extr�m�ly �amiliar or part tim� 34% V�ry �amiliar S�l�-�mploy�d 6% �anag�r, �x�cutiv�, or... 8% 43% 27% Un�mploy�d but 2% 18% Familiar Sy�t�m admini�trator looking �or �ork Ex�cutiv� (C-l�v�l) 17% Slightly �amiliar 0% R�tir�d 1% Not �amiliar at all 0% Hard�ar� �ngin��r 14% Stud�nt 0% Don’t kno� 0% Un�mploy�d and 11% Pro����ional... or not �ur� not curr�ntly 0% looking �or �ork Sci�nti�t, r���arch�r... 9% Q1, Sampl� �iz� = 496 Don’t kno� 0% Lic�n�ing/complianc� or not �ur� 4% L�gal coun��l 3% Q3, Sampl� �iz� = 496 Oth�r (pl�a�� �p�ci�y) 2% Stud�nt 0% Sal�� or mark�ting 0% Don’t kno� or not �ur� 0% Q4, Sampl� �iz� = 496; Total m�ntion� = 810 • 155 (31%) responses from Linux Foundation Research For more details about the screening criteria used and partners: Ecma International, SPDX, RISC-V International, JDF, access to the survey dataset, see http://www.data.world/ Open Chain, and OCI. thelinuxfoundation. • 46 (9%) responses from Linux Foundation community How missing data is handled: Although respondents are members. required to answer nearly all questions in the survey (the only exceptions are the open-ended questions), there are times THE 2023 STATE OF OPEN STANDARDS EMPIRICAL RESEARCH ON THE TRANSITION TO OPEN STANDARDS 33
 The 2023 State of Open Standards Page 32 Page 34